Pluck Chart
Pluck Charts combine possession and luck data for NHL teams into one easy-to-read chart. This chart is updated daily.
Legend
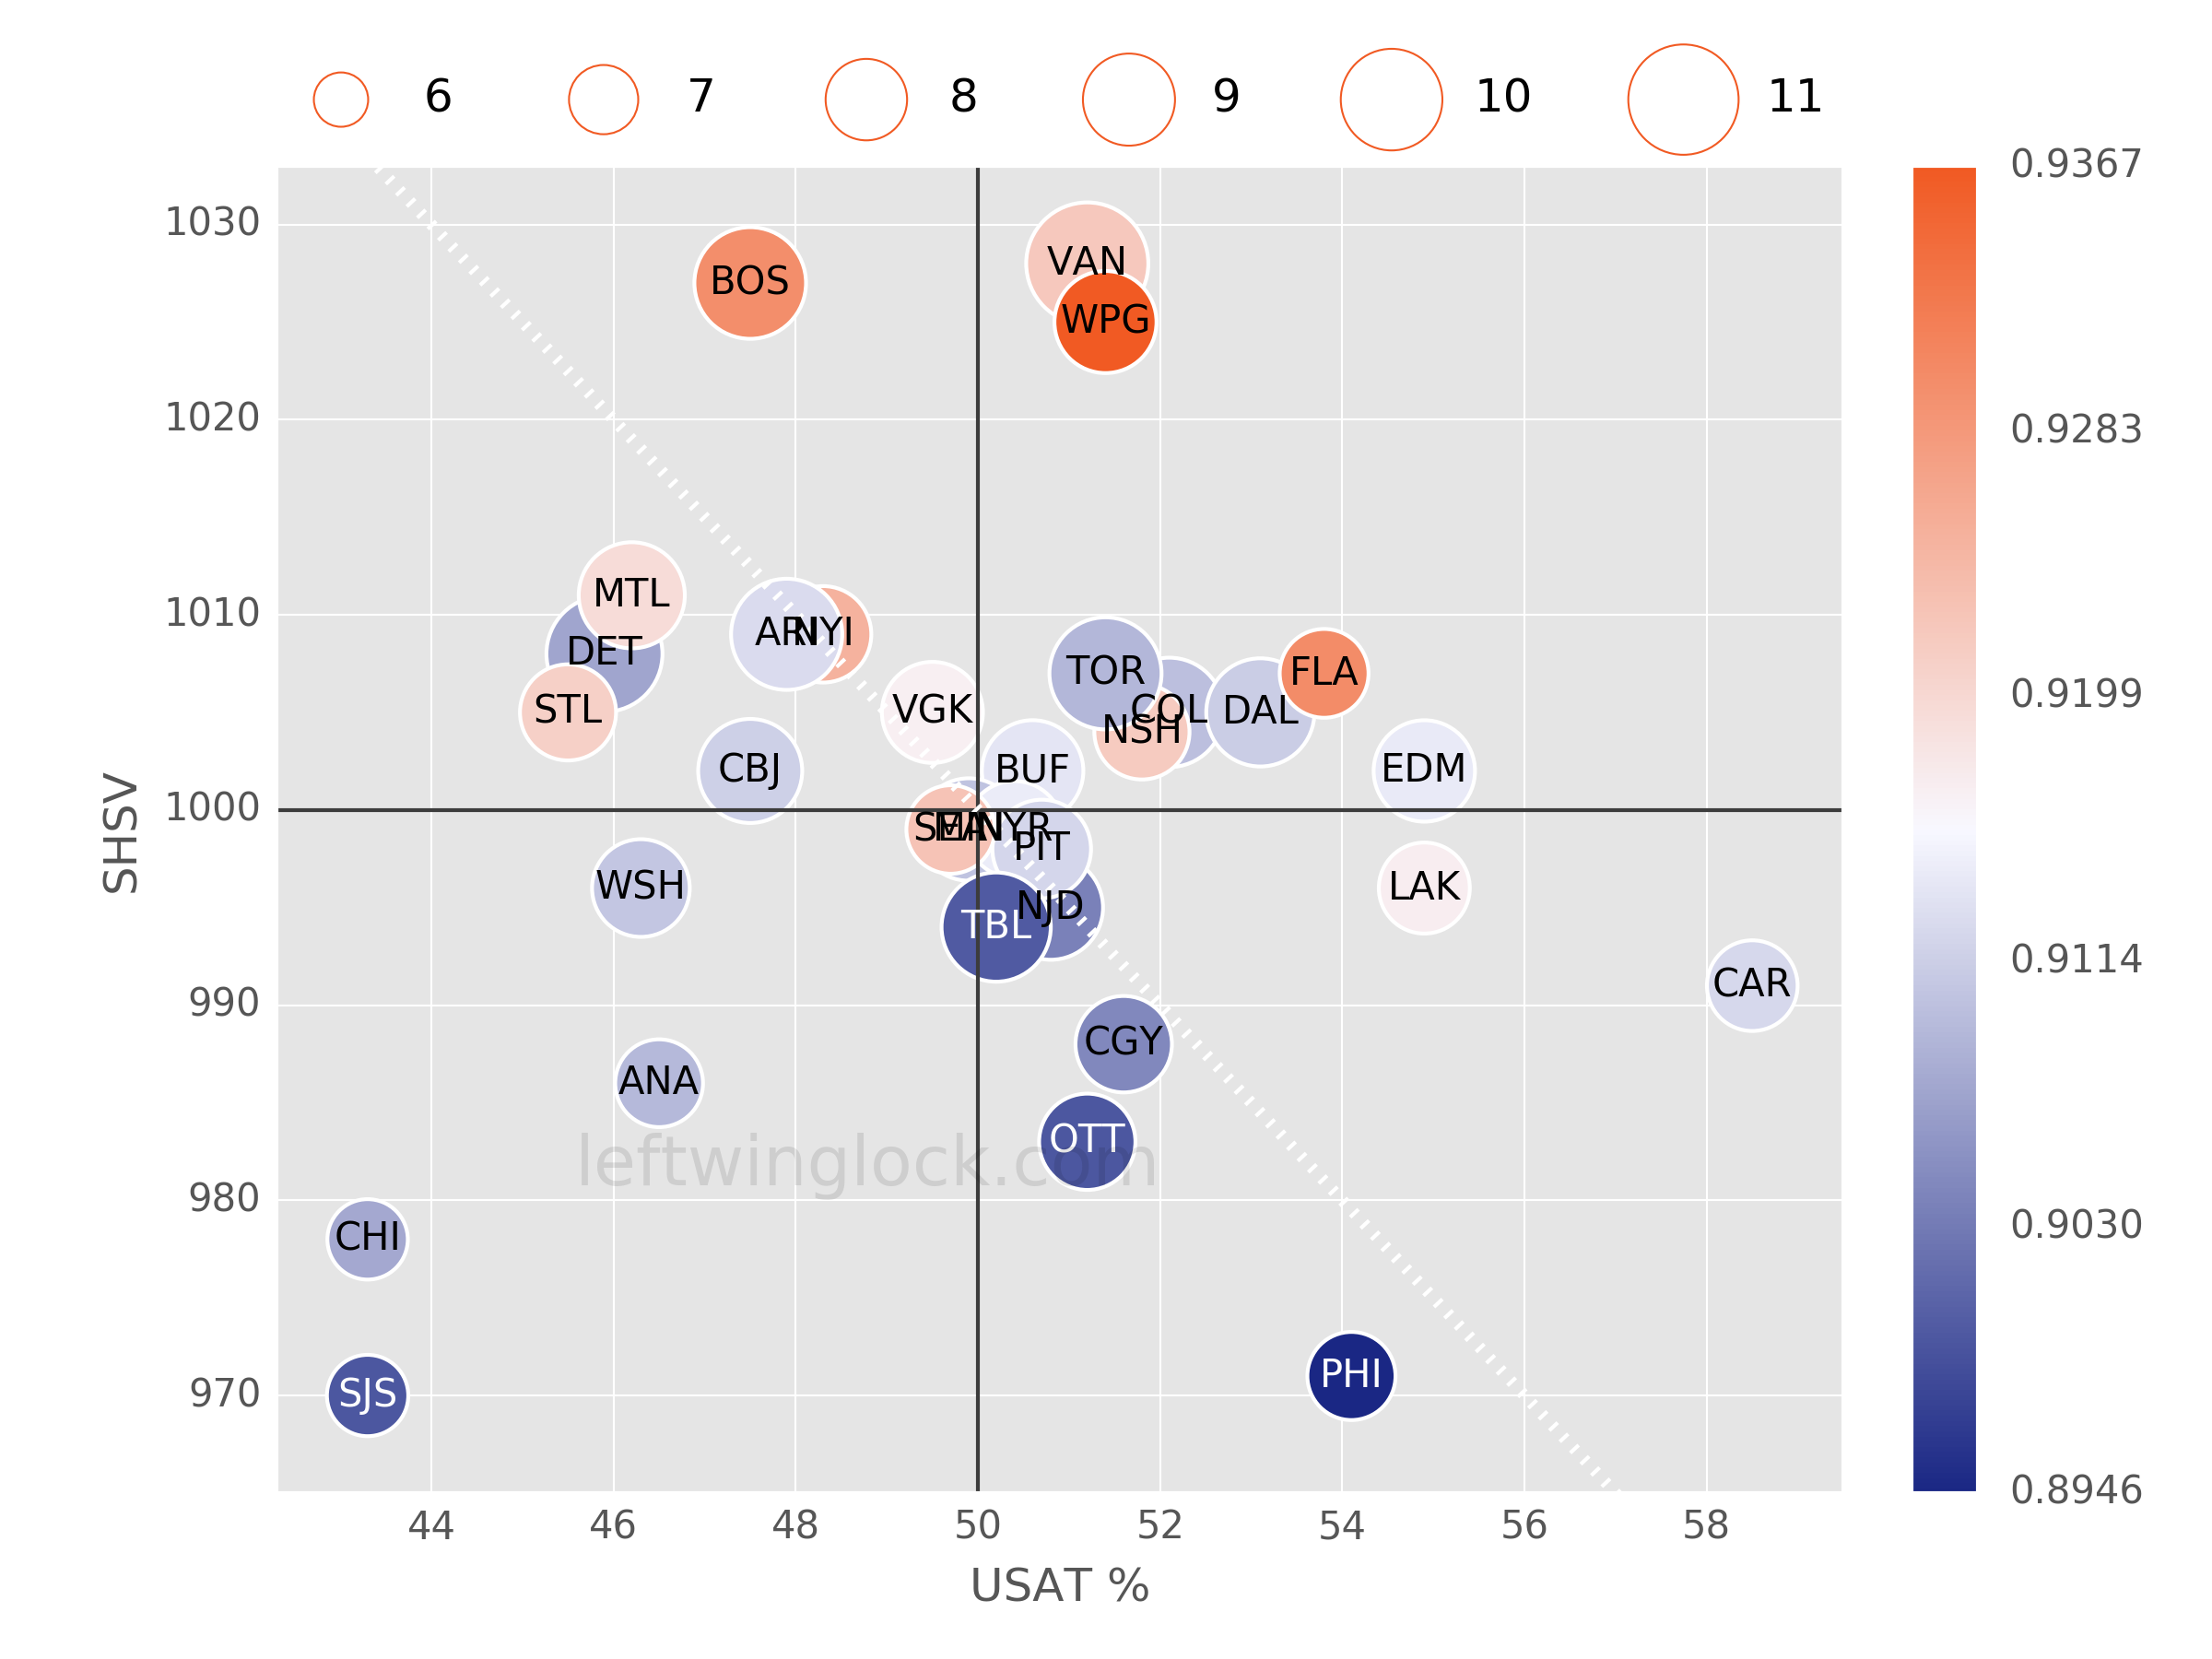
Bubble's Horizontal Position: The x-axis measures puck possession and uses USAT% as the metric. USAT% is computed by finding what fraction of all unblocked shot attempts in games were generated by the team in question. A USAT% value greater than 50% suggests that a team is consistently outshooting their opponents.
Bubble's Vertical Position: The y-axis measures luck at even-strength hockey and uses SHSV% as the metric. SHSV% is computed by using a team's even-strength shooting percentage and adding it to the team's even-strength save percentage (multiplied by 1000). Teams with values that stray significantly from 1000 are having their results influenced by luck.
Bubble's Size: The size of each bubble measures the even-strength shooting percentage of a team. The league average value in recent seasons is ~8.8%.
Bubble's Color: The color of each bubble measures the even-strength save percentage of a team. The league average value in recent seasons is ~0.912.
Dashed White Line: Historically, teams above the dashed white line are the most likely to qualify for the playoffs.