Alexander Barabanov
Explore projections, stats, news, player usage charts, and line combinations for members of the San Jose Sharks
-
Left Wing Leaders
2023 - 2024
Name PPG PPA PPP Artemi
Panarin11 33 44 Kirill Kaprizov 19 22 41 Filip Forsberg 13 19 32 Matthew Tkachuk 6 26 32 Kevin Fiala 11 19 30 Chris Kreider 18 11 29 Alex Ovechkin 13 15 28 Jason Robertson 9 19 28 Jesper Bratt 7 20 27 Brad Marchand 7 19 26 Matt Boldy 10 15 25 Jared McCann 9 14 23 -
Player Card

Alexander Barabanov
San Jose Sharks2023 - 2024- G 4
- A 9
- PTS 13
- +/- -24
- PIM 12
- PPP 2
- SH% 6
- L 53%
- C 0%
- R 47%
-
San Jose Sharks Leaders
2023 - 2024
Name G A Pts Mikael
Granlund12 48 60 William Eklund 16 29 45 Fabian Zetterlund 24 20 44 Filip Zadina 13 10 23 Mike Hoffman 10 13 23 Mario Ferraro 3 18 21 Jan Rutta 5 14 19 Luke Kunin 11 7 18 Calen Addison 1 16 17 Klim Kostin 8 6 14 Justin Bailey 5 9 14 Nico Sturm 5 8 13
News
-
Alexander Barabanov
Is week-to-week with a lower-body injury.
Mar 28, 2024 - 1:04 pm -
Alexander Barabanov
Is considered day-to-day with a lower-body injury.
Mar 2, 2024 - 12:40 pm -
Alexander Barabanov
Is not expected to be in the lineup for today's game.
Feb 19, 2024 - 3:38 pm -
Alexander Barabanov
Will miss tonight's game against the Vancouver Canucks due to illness.
Dec 23, 2023 - 3:22 pm
Feature
-
Trending
Buy-Low and Sell-High: Skaters
Replies 0
Basic Stats
| Season | Team | GP | G | A | P | +/- | PIM | S | S/GP | SH% | PPP | H | BS | FW | FO% | TOI | EVTOI | PPTOI | PKTOI |
|---|---|---|---|---|---|---|---|---|---|---|---|---|---|---|---|---|---|---|---|
| 23-24 | SJS | 46 | 4 | 9 | 13 | -24 | 12 | 67 | 1.5 | 6.0 | 2 | 27 | 15 | 2 | 40.0 | 15.87 | 13.93 | 1.93 | 0.01 |
| 22-23 | SJS | 68 | 15 | 32 | 47 | -30 | 20 | 120 | 1.8 | 12.5 | 13 | 40 | 37 | 1 | 33.3 | 18.05 | 15.27 | 2.76 | 0.02 |
| 21-22 | SJS | 70 | 10 | 29 | 39 | -5 | 14 | 103 | 1.5 | 9.7 | 8 | 53 | 39 | 0 | 0.0 | 17.18 | 15.32 | 1.85 | 0.00 |
| 20-21 | TOR | 22 | 3 | 5 | 8 | 1 | 6 | 23 | 1 | 13.0 | 1 | 7 | 14 | 0 | 0.0 | 12.31 | 10.97 | 1.34 | 0.00 |
Enhanced Stats (5-on-5 unless denoted with *)
| Season | G/60 | A/60 | P/60 | IPP | ΔPEN/60 | 1A | 2A | EVS/60* | PPS/60* | SATF | SAT% | tEVSH% | tEVSV% | SHSV | ZS% |
|---|---|---|---|---|---|---|---|---|---|---|---|---|---|---|---|
| 23-24 | 0.39 | 0.29 | 0.68 | 50 | -0.08 | 3 | 0 | 5.5 | 5.4 | 573 | 44.9 | 5.9 | 0.890 | 949 | 47.9 |
| 22-23 | 0.73 | 1.28 | 2.02 | 69 | -0.05 | 13 | 8 | 5.5 | 8.6 | 898 | 49.7 | 10.3 | 0.876 | 979 | 46.5 |
| 21-22 | 0.35 | 1.28 | 1.63 | 61 | 0.35 | 13 | 9 | 4.7 | 8.8 | 920 | 46.1 | 9.4 | 0.927 | 1021 | 44.7 |
| 20-21 | 0.26 | 1.04 | 1.31 | 33 | 0.00 | 2 | 2 | 5.0 | 4.1 | 188 | 45.9 | 11.1 | 0.895 | 1006 | 40.8 |
Regression Meter
This meter measures whether or not a player's point production is being influenced by luck. Orange indicates the player has been lucky. Dark grey indicates the player has been unlucky.
2A/60
tEVSH%
SH%
IPP
PPSH%
Positional Data
| Season | Team | Left | Center | Right |
|---|---|---|---|---|
| 23-24 | SJS | 53 | 0 | 47 |
| 22-23 | SJ | 2 | 0 | 98 |
| 21-22 | SJ | 55 | 0 | 45 |
| 20-21 | TOR | 100 | 0 | 0 |
Most Common Linemates and Line Production
See also: San Jose Sharks Line Combo Tool | Line Production Tool
| Team | F1 | F2 | F3 | GF | GA | GF% | SATF | SATA | SAT% | USATF | USATA | USAT% | SH% | SV% | SHSV | ZS% |
|---|---|---|---|---|---|---|---|---|---|---|---|---|---|---|---|---|
| SJS | BARABANOV | HERTL | EKLUND | 1 | 6 | 14.3 | 100 | 94 | 51.5 | 71 | 66 | 51.8 | 2.4 | 0.867 | 890 | 48.6 |
| SJS | BARABANOV | GRANLUND | ZETTERLUND | 1 | 4 | 20.0 | 70 | 75 | 48.3 | 48 | 58 | 45.3 | 3.4 | 0.892 | 926 | 52.6 |
| SJS | BARABANOV | COUTURE | DUCLAIR | 1 | 2 | 33.3 | 46 | 60 | 43.4 | 23 | 42 | 35.4 | 5.9 | 0.933 | 992 | 57.1 |
Most Recent 10 Games
| OPP | G | A | P | +/- | PIM | SOG | SH% | H | BS | FW | FL | FO% | TOI | EVTOI | PPTOI | PKTOI | ID |
|---|---|---|---|---|---|---|---|---|---|---|---|---|---|---|---|---|---|
| DAL | 1 | 0 | 1 | -1 | 0 | 1 | 100 | 0 | 0 | 0 | 0 | 0 | 09:15 | 08:29 | 00:46 | 00:00 | 21147 |
| CHI | 0 | 0 | 0 | 0 | 0 | 4 | 0 | 0 | 1 | 0 | 2 | 0 | 16:30 | 15:04 | 01:26 | 00:00 | 21122 |
| TBL | 0 | 0 | 0 | -1 | 0 | 3 | 0 | 0 | 0 | 0 | 0 | 0 | 15:30 | 12:09 | 03:21 | 00:00 | 21108 |
| CHI | 0 | 1 | 1 | 0 | 2 | 2 | 0 | 0 | 0 | 1 | 0 | 100 | 10:31 | 10:31 | 00:00 | 00:00 | 21076 |
| CBJ | 0 | 0 | 0 | -1 | 0 | 0 | 0 | 0 | 0 | 0 | 0 | 0 | 12:44 | 11:02 | 01:42 | 00:00 | 21065 |
| PIT | 0 | 0 | 0 | 2 | 0 | 1 | 0 | 0 | 0 | 1 | 0 | 100 | 17:28 | 15:26 | 01:54 | 00:08 | 21051 |
| PHI | 0 | 1 | 1 | 0 | 0 | 1 | 0 | 1 | 1 | 0 | 0 | 0 | 18:20 | 14:07 | 04:13 | 00:00 | 21035 |
| OTT | 0 | 0 | 0 | 0 | 2 | 2 | 0 | 0 | 0 | 0 | 0 | 0 | 18:03 | 16:22 | 01:41 | 00:00 | 21015 |
| DAL | 0 | 0 | 0 | 0 | 0 | 2 | 0 | 0 | 0 | 0 | 0 | 0 | 17:50 | 16:51 | 00:59 | 00:00 | 20989 |
| ANA | 0 | 0 | 0 | -2 | 0 | 0 | 0 | 0 | 0 | 0 | 0 | 0 | 08:08 | 06:05 | 02:03 | 00:00 | 20952 |
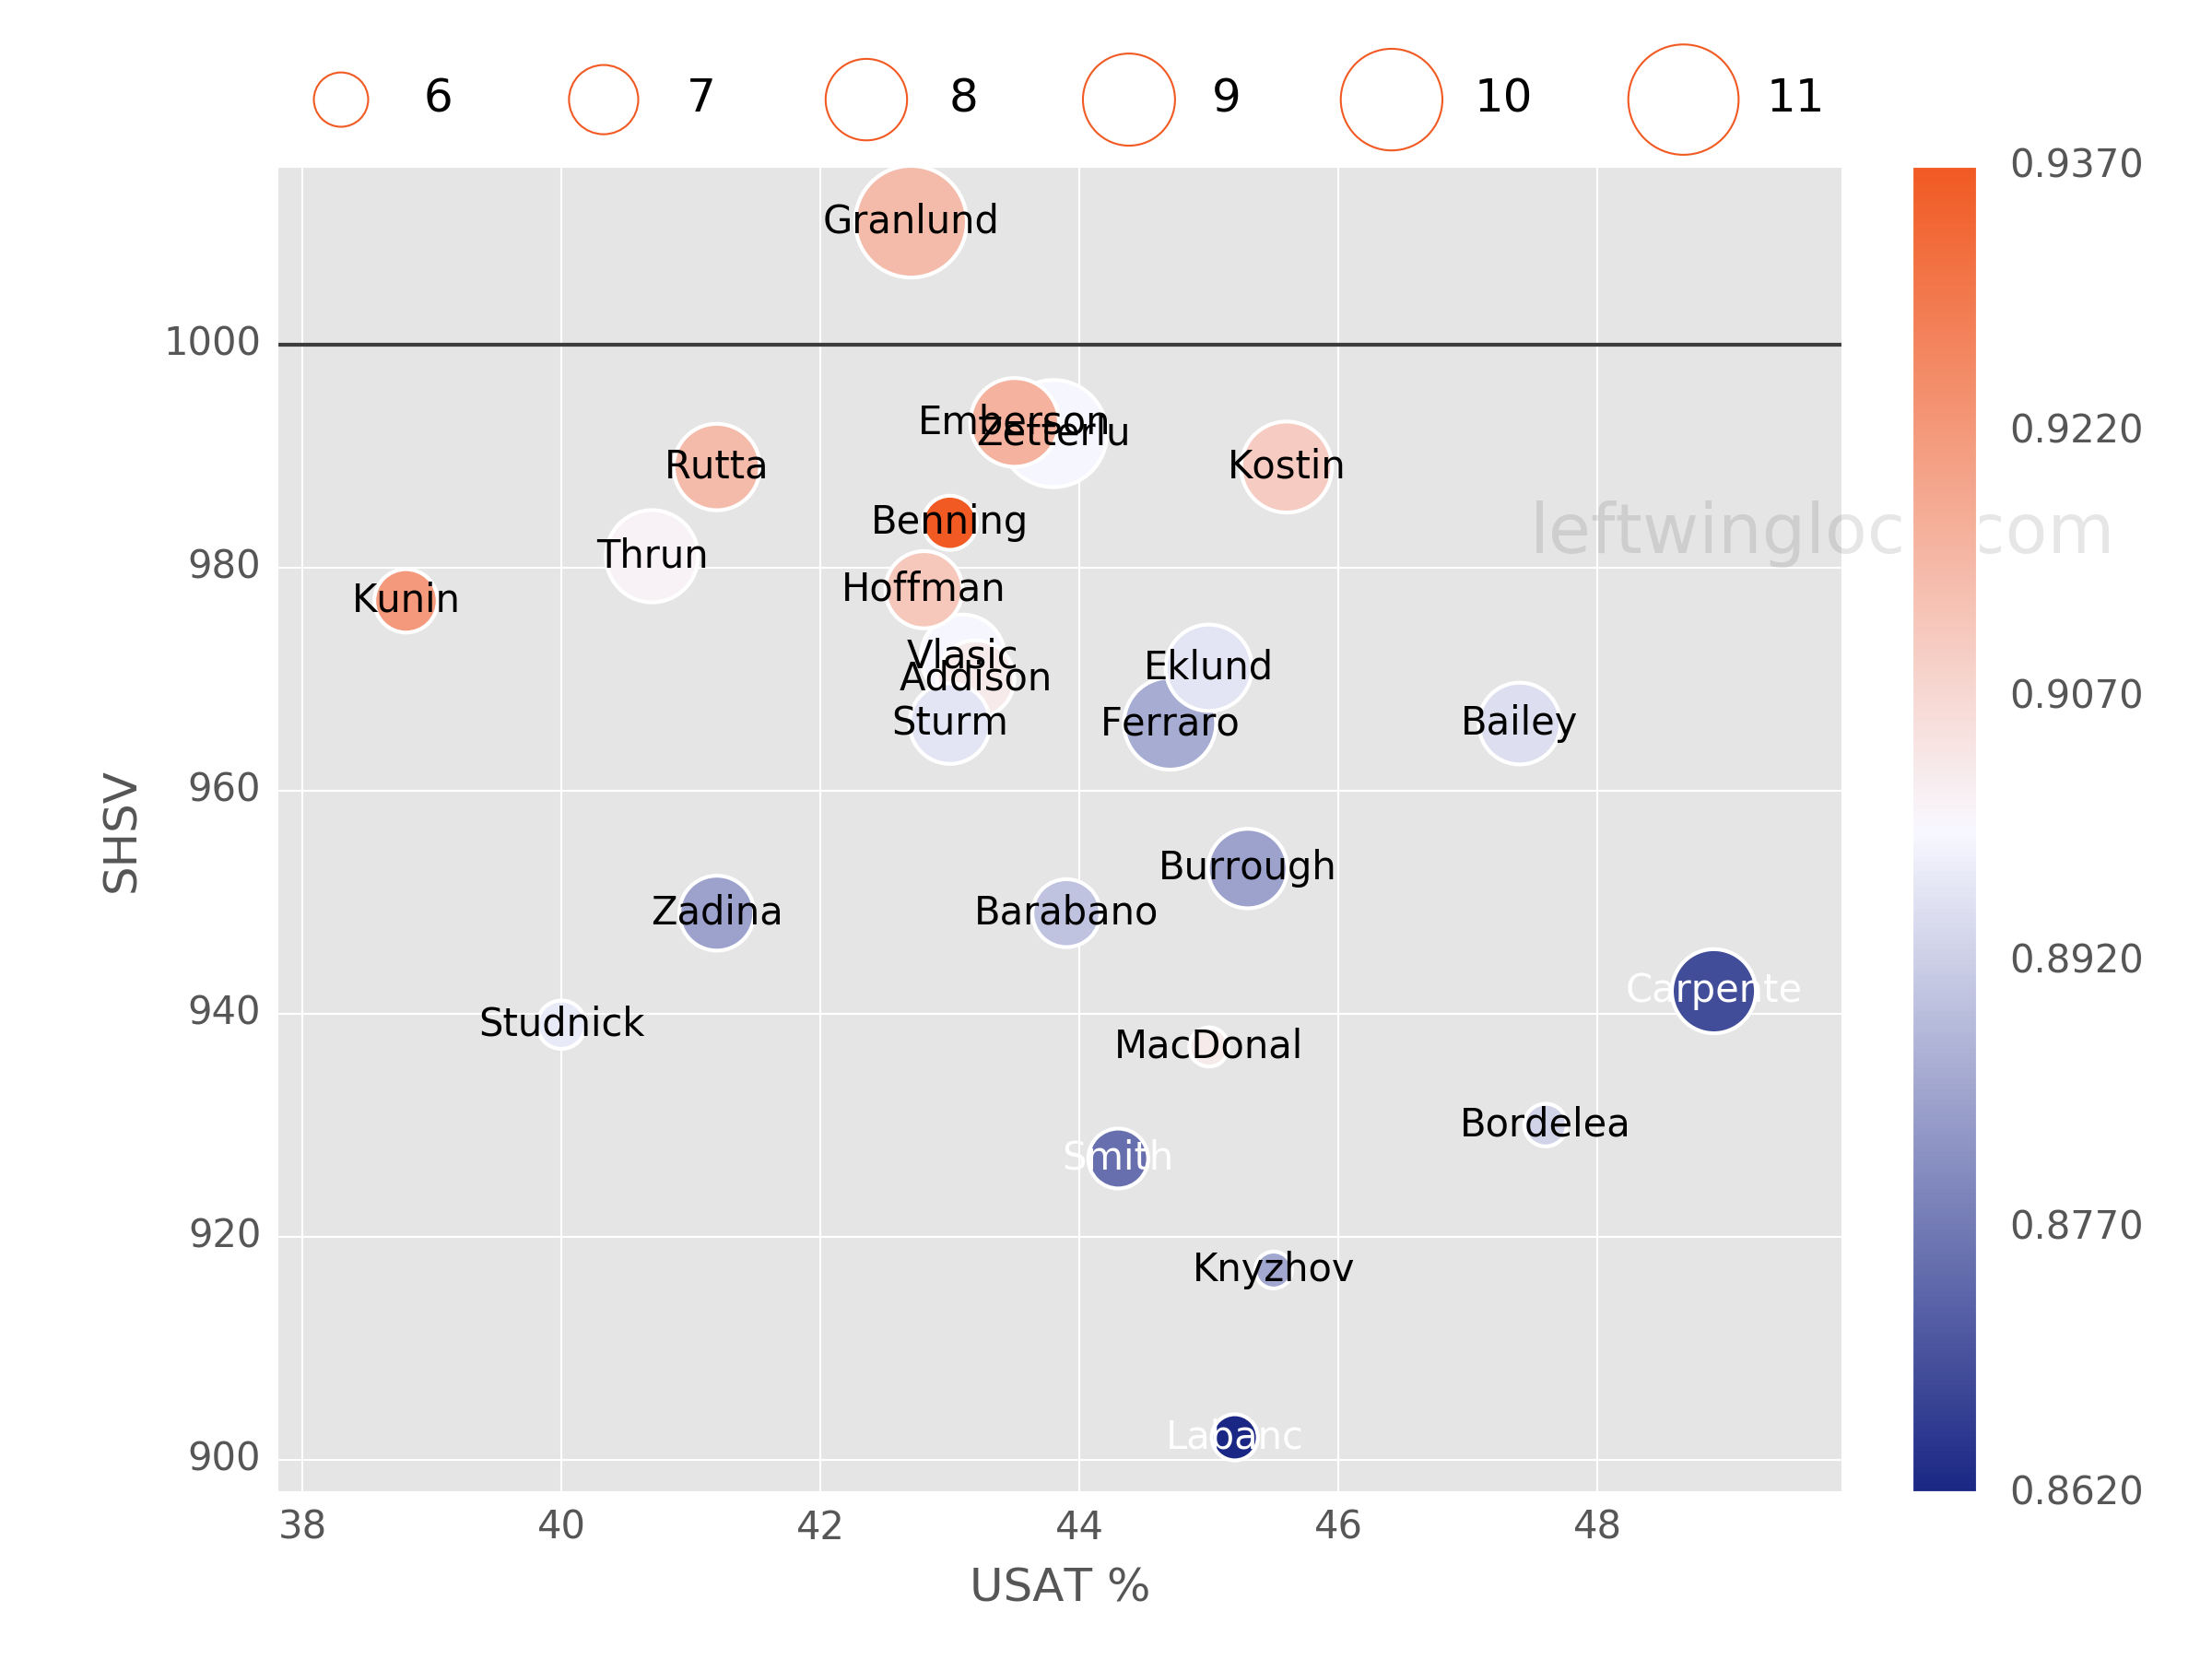
Player Usage Chart / Possession and Luck Chart