RYAN JOHANSEN
Explore projections, stats, news, player usage charts, and line combinations for members of the Philadelphia Flyers
-
Center Leaders
2023 - 2024
Name G A Pts Nathan
MacKinnon51 89 140 Connor McDavid 32 100 132 Auston Matthews 69 38 107 Leon Draisaitl 41 65 106 J.T. Miller 37 66 103 Sam Reinhart 57 37 94 Sidney Crosby 42 52 94 Brayden Point 46 44 90 Sebastian Aho 36 53 89 Elias Pettersson 34 55 89 Robert Thomas 26 60 86 Steven Stamkos 40 41 81 -
Player Card

RYAN JOHANSEN
Philadelphia Flyers2023 - 2024- G 13
- A 10
- PTS 23
- +/- -6
- PIM 34
- PPP 6
- SH% 16.7
- L 0%
- C 0%
- R 0%
-
Philadelphia Flyers Leaders
2023 - 2024
Name PPG PPA PPP Morgan
Frost3 8 11 Travis Konecny 4 5 9 Egor Zamula 2 7 9 Owen Tippett 5 3 8 Tyson Foerster 4 4 8 Sean Couturier 3 4 7 Joel Farabee 2 5 7 Ryan Johansen 4 2 6 Cam Atkinson 2 4 6 Cam York 0 6 6 Bobby Brink 3 2 5 Scott Laughton 1 4 5
News
-
Ryan Johansen
Has cleared waivers.
Mar 7, 2024 - 2:15 pm -
Ryan Johansen
Has been placed on waivers.
Mar 6, 2024 - 2:11 pm -
Ryan Johansen
Has been traded to the Philadelphia Flyers, along with a 2025 1st round draft pick, in exchange for Sean Walker and a 2026 5th round draft pick.
Mar 6, 2024 - 2:10 pm -
Ryan Johansen
Has been traded to the Colorado Avalanche in exchange for Alex Galchenyuk.
Jun 24, 2023 - 12:02 pm
Feature
-
Trending
Buy-Low and Sell-High: Skaters
Replies 0
Basic Stats
| Season | Team | GP | G | A | P | +/- | PIM | S | S/GP | SH% | PPP | H | BS | FW | FO% | TOI | EVTOI | PPTOI | PKTOI |
|---|---|---|---|---|---|---|---|---|---|---|---|---|---|---|---|---|---|---|---|
| 23-24 | PHI | 63 | 13 | 10 | 23 | -6 | 34 | 78 | 1.2 | 16.7 | 6 | 60 | 15 | 431 | 53.1 | 13.64 | 11.44 | 1.89 | 0.31 |
| 22-23 | NSH | 55 | 12 | 16 | 28 | -13 | 32 | 86 | 1.6 | 14.0 | 10 | 49 | 19 | 502 | 59.2 | 15.76 | 12.56 | 3.16 | 0.05 |
| 21-22 | NSH | 79 | 26 | 37 | 63 | -2 | 53 | 118 | 1.5 | 22.0 | 24 | 72 | 35 | 691 | 52.6 | 16.56 | 13.33 | 3.04 | 0.19 |
| 20-21 | NSH | 48 | 7 | 15 | 22 | 0 | 22 | 67 | 1.4 | 10.5 | 7 | 43 | 16 | 424 | 51.6 | 16.94 | 13.71 | 2.74 | 0.50 |
| 19-20 | NSH | 68 | 14 | 22 | 36 | -5 | 45 | 101 | 1.5 | 13.9 | 9 | 39 | 34 | 549 | 53.2 | 17.06 | 13.47 | 2.69 | 0.90 |
Enhanced Stats (5-on-5 unless denoted with *)
| Season | G/60 | A/60 | P/60 | IPP | ΔPEN/60 | 1A | 2A | EVS/60* | PPS/60* | SATF | SAT% | tEVSH% | tEVSV% | SHSV | ZS% |
|---|---|---|---|---|---|---|---|---|---|---|---|---|---|---|---|
| 23-24 | 0.70 | 0.52 | 1.22 | 0 | -0.14 | 5 | 1 | 4.9 | 9.6 | 622 | 48.1 | 7.2 | 0.924 | 996 | 44.5 |
| 22-23 | 0.57 | 0.85 | 1.42 | 71 | -0.62 | 5 | 4 | 4.8 | 10.7 | 644 | 51.4 | 6.8 | 0.916 | 984 | 53.9 |
| 21-22 | 0.70 | 1.14 | 1.84 | 62 | -0.73 | 4 | 14 | 4.1 | 10.8 | 849 | 48.4 | 11.0 | 0.914 | 1024 | 53.7 |
| 20-21 | 0.30 | 1.09 | 1.39 | 59 | -0.37 | 5 | 6 | 4.7 | 7.3 | 552 | 51.1 | 6.9 | 0.938 | 1007 | 57.2 |
| 19-20 | 0.69 | 0.83 | 1.53 | 63 | -0.57 | 4 | 8 | 5.3 | 6.2 | 847 | 51.2 | 8.0 | 0.919 | 999 | 53.3 |
Regression Meter
This meter measures whether or not a player's point production is being influenced by luck. Orange indicates the player has been lucky. Dark grey indicates the player has been unlucky.
Positional Data
| Season | Team | Left | Center | Right |
|---|---|---|---|---|
| 23-24 | PHI | 0 | 0 | 0 |
| 22-23 | NSH | 0 | 100 | 0 |
| 21-22 | NSH | 0 | 100 | 0 |
| 20-21 | NSH | 0 | 100 | 0 |
| 19-20 | NSH | 0 | 100 | 0 |
Most Common Linemates and Line Production
See also: Philadelphia Flyers Line Combo Tool | Line Production Tool
| Team | F1 | F2 | F3 | GF | GA | GF% | SATF | SATA | SAT% | USATF | USATA | USAT% | SH% | SV% | SHSV | ZS% |
|---|---|---|---|---|---|---|---|---|---|---|---|---|---|---|---|---|
| COL | TATAR | JOHANSEN | DROUIN | 6 | 3 | 66.7 | 78 | 85 | 47.9 | 54 | 64 | 45.8 | 16.2 | 0.921 | 1083 | 42.4 |
| COL | LEHKONEN | JOHANSEN | NICHUSHKIN | 1 | 1 | 50.0 | 46 | 28 | 62.2 | 34 | 17 | 66.7 | 4.0 | 0.923 | 963 | 58.8 |
| COL | DROUIN | JOHANSEN | PARISE | 1 | 0 | 100.0 | 45 | 36 | 55.6 | 30 | 23 | 56.6 | 4.5 | 1.000 | 1045 | 44.4 |
Most Recent 10 Games
| OPP | G | A | P | +/- | PIM | SOG | SH% | H | BS | FW | FL | FO% | TOI | EVTOI | PPTOI | PKTOI | ID |
|---|---|---|---|---|---|---|---|---|---|---|---|---|---|---|---|---|---|
| CHI | 0 | 0 | 0 | 0 | 0 | 0 | 0 | 2 | 1 | 6 | 5 | 55 | 10:58 | 10:58 | 00:00 | 00:00 | 20979 |
| NSH | 0 | 0 | 0 | 0 | 0 | 0 | 0 | 2 | 1 | 1 | 5 | 17 | 11:48 | 11:48 | 00:00 | 00:00 | 20959 |
| CHI | 0 | 1 | 1 | 1 | 0 | 1 | 0 | 3 | 0 | 5 | 7 | 42 | 15:27 | 15:27 | 00:00 | 00:00 | 20949 |
| DAL | 0 | 0 | 0 | 0 | 0 | 3 | 0 | 0 | 0 | 8 | 7 | 53 | 13:27 | 13:27 | 00:00 | 00:00 | 20936 |
| TOR | 0 | 0 | 0 | 0 | 0 | 1 | 0 | 1 | 0 | 6 | 5 | 55 | 14:33 | 14:33 | 00:00 | 00:00 | 20908 |
| DET | 0 | 0 | 0 | 0 | 0 | 1 | 0 | 0 | 0 | 4 | 6 | 40 | 11:40 | 10:17 | 00:00 | 01:23 | 20890 |
| VAN | 2 | 0 | 2 | 2 | 0 | 2 | 100 | 0 | 0 | 3 | 7 | 30 | 12:11 | 10:58 | 01:13 | 00:00 | 20881 |
| ARI | 0 | 1 | 1 | 1 | 0 | 0 | 0 | 0 | 0 | 9 | 6 | 60 | 13:26 | 08:54 | 02:18 | 02:14 | 20864 |
| TBL | 0 | 0 | 0 | -1 | 0 | 2 | 0 | 2 | 0 | 8 | 8 | 50 | 12:06 | 11:24 | 00:42 | 00:00 | 20842 |
| WSH | 0 | 1 | 1 | 1 | 0 | 0 | 0 | 0 | 1 | 3 | 3 | 50 | 09:30 | 08:54 | 00:00 | 00:36 | 20828 |
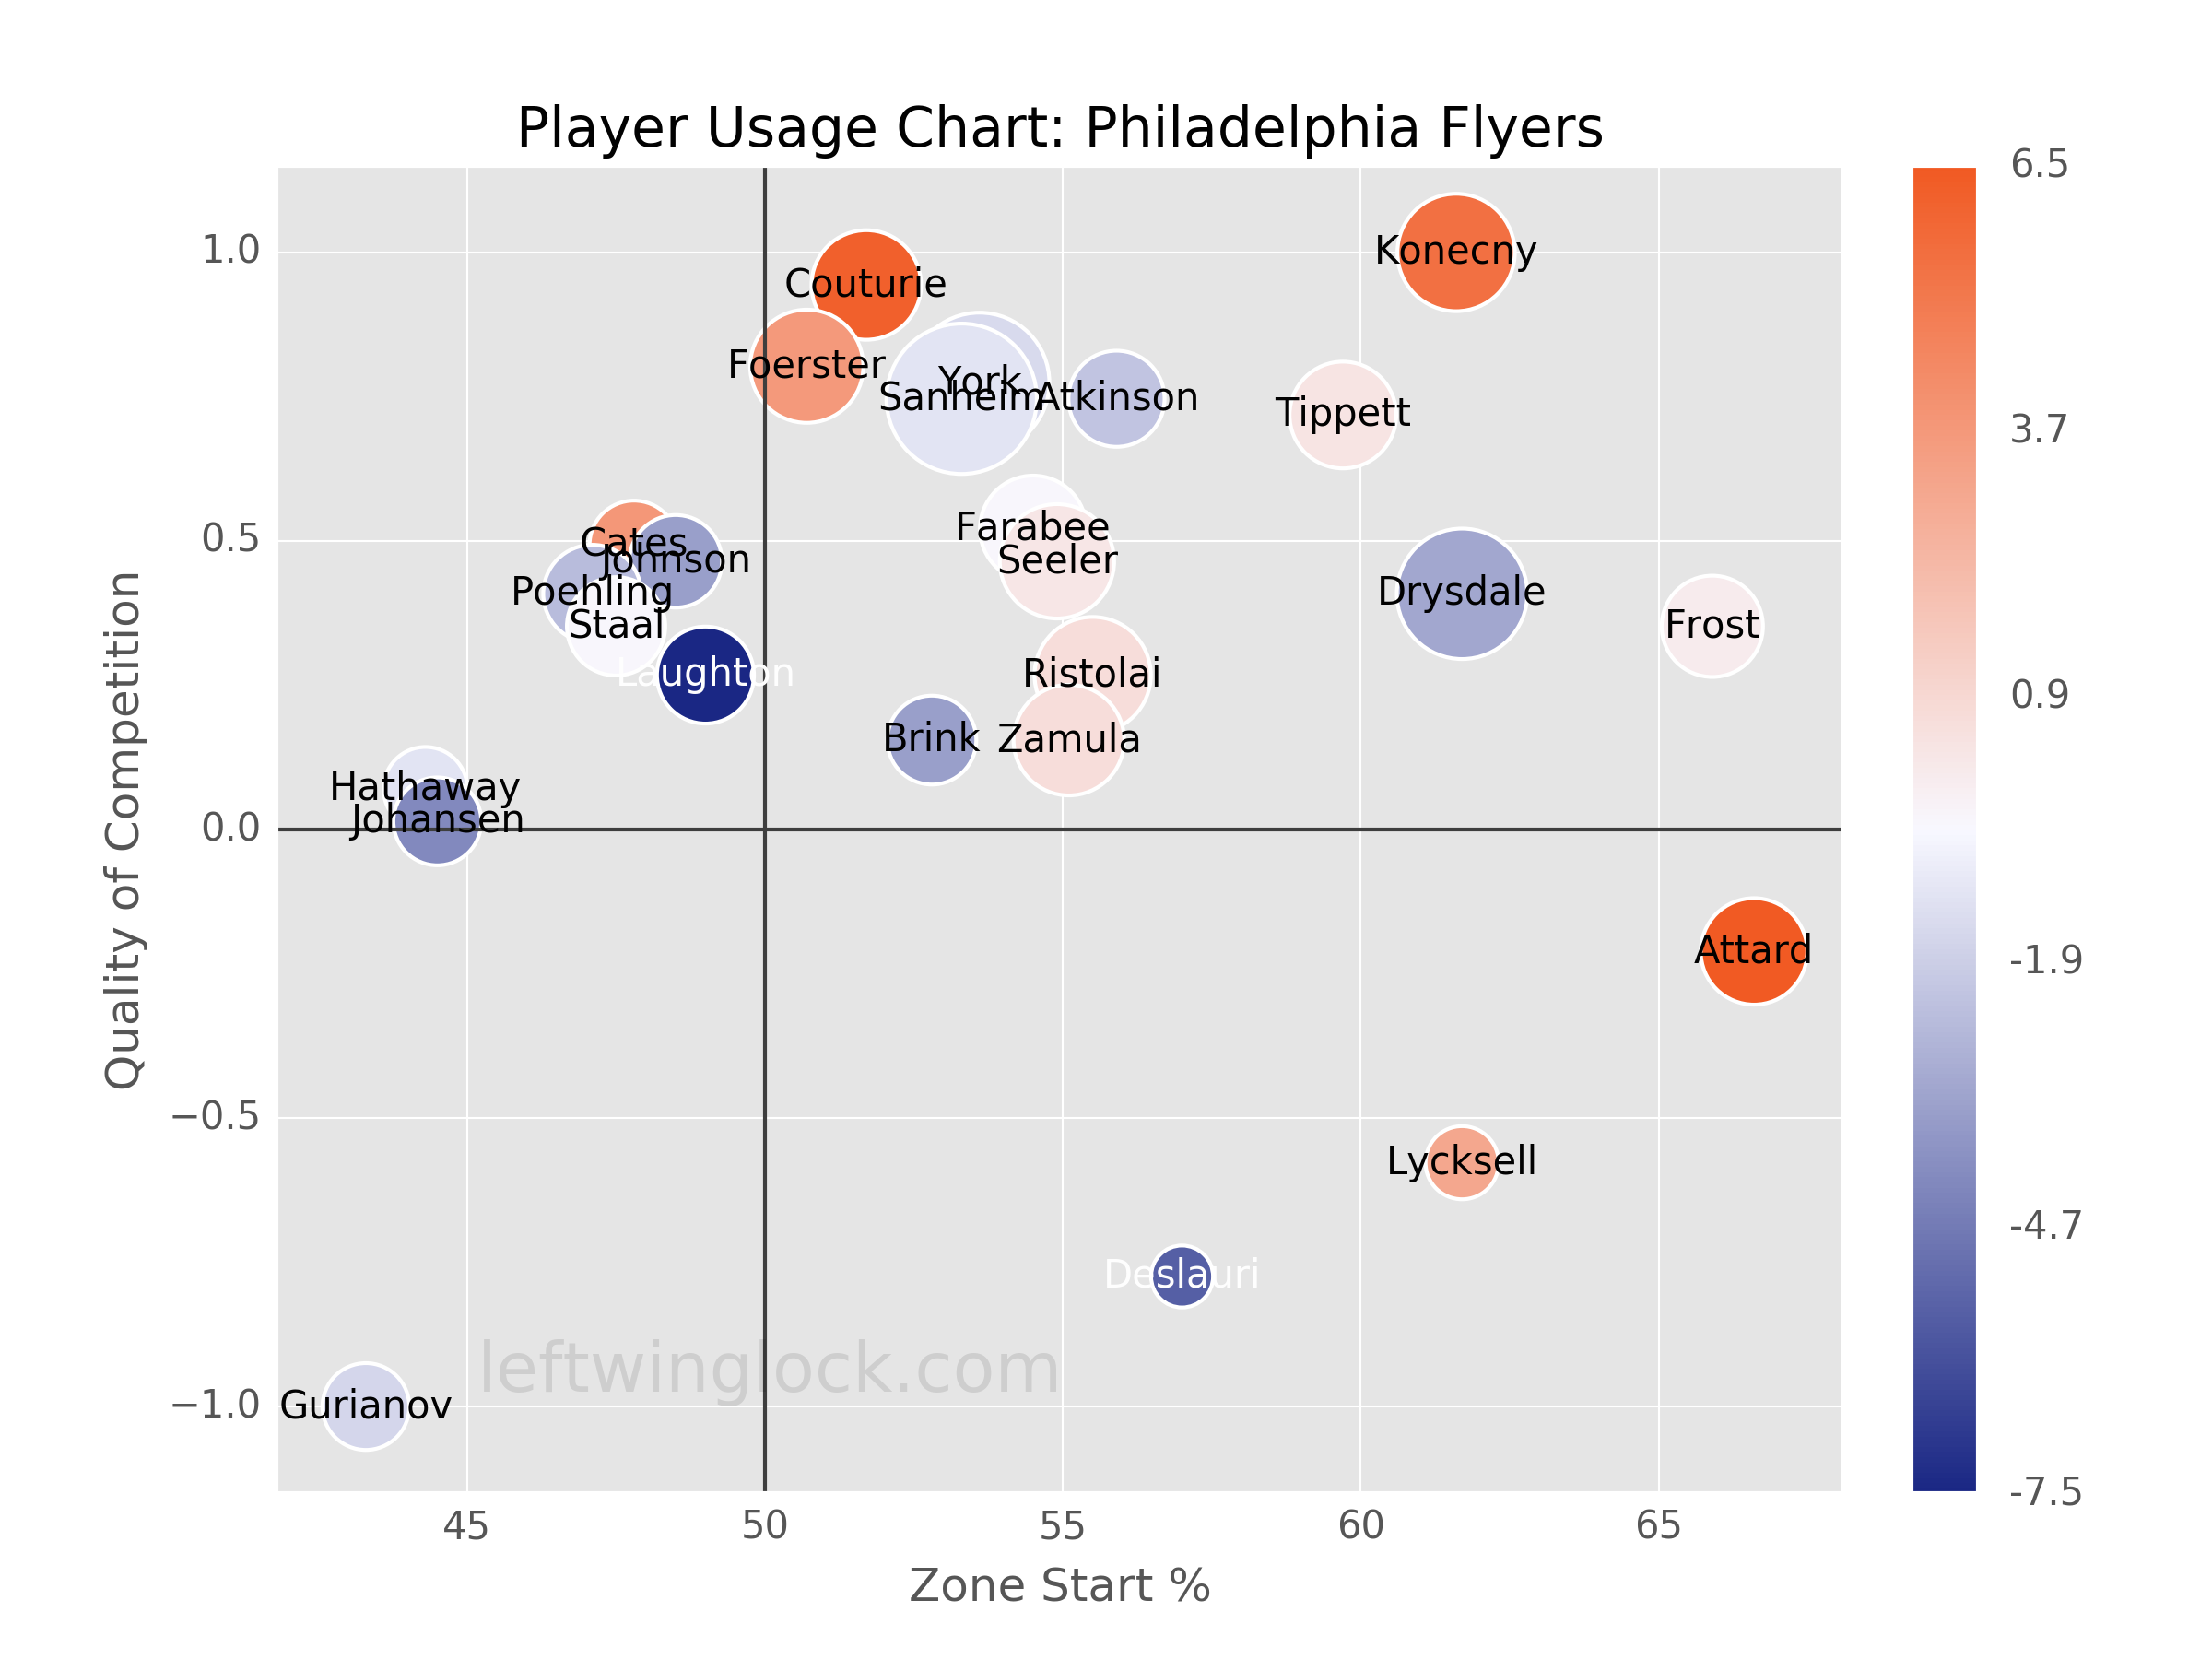
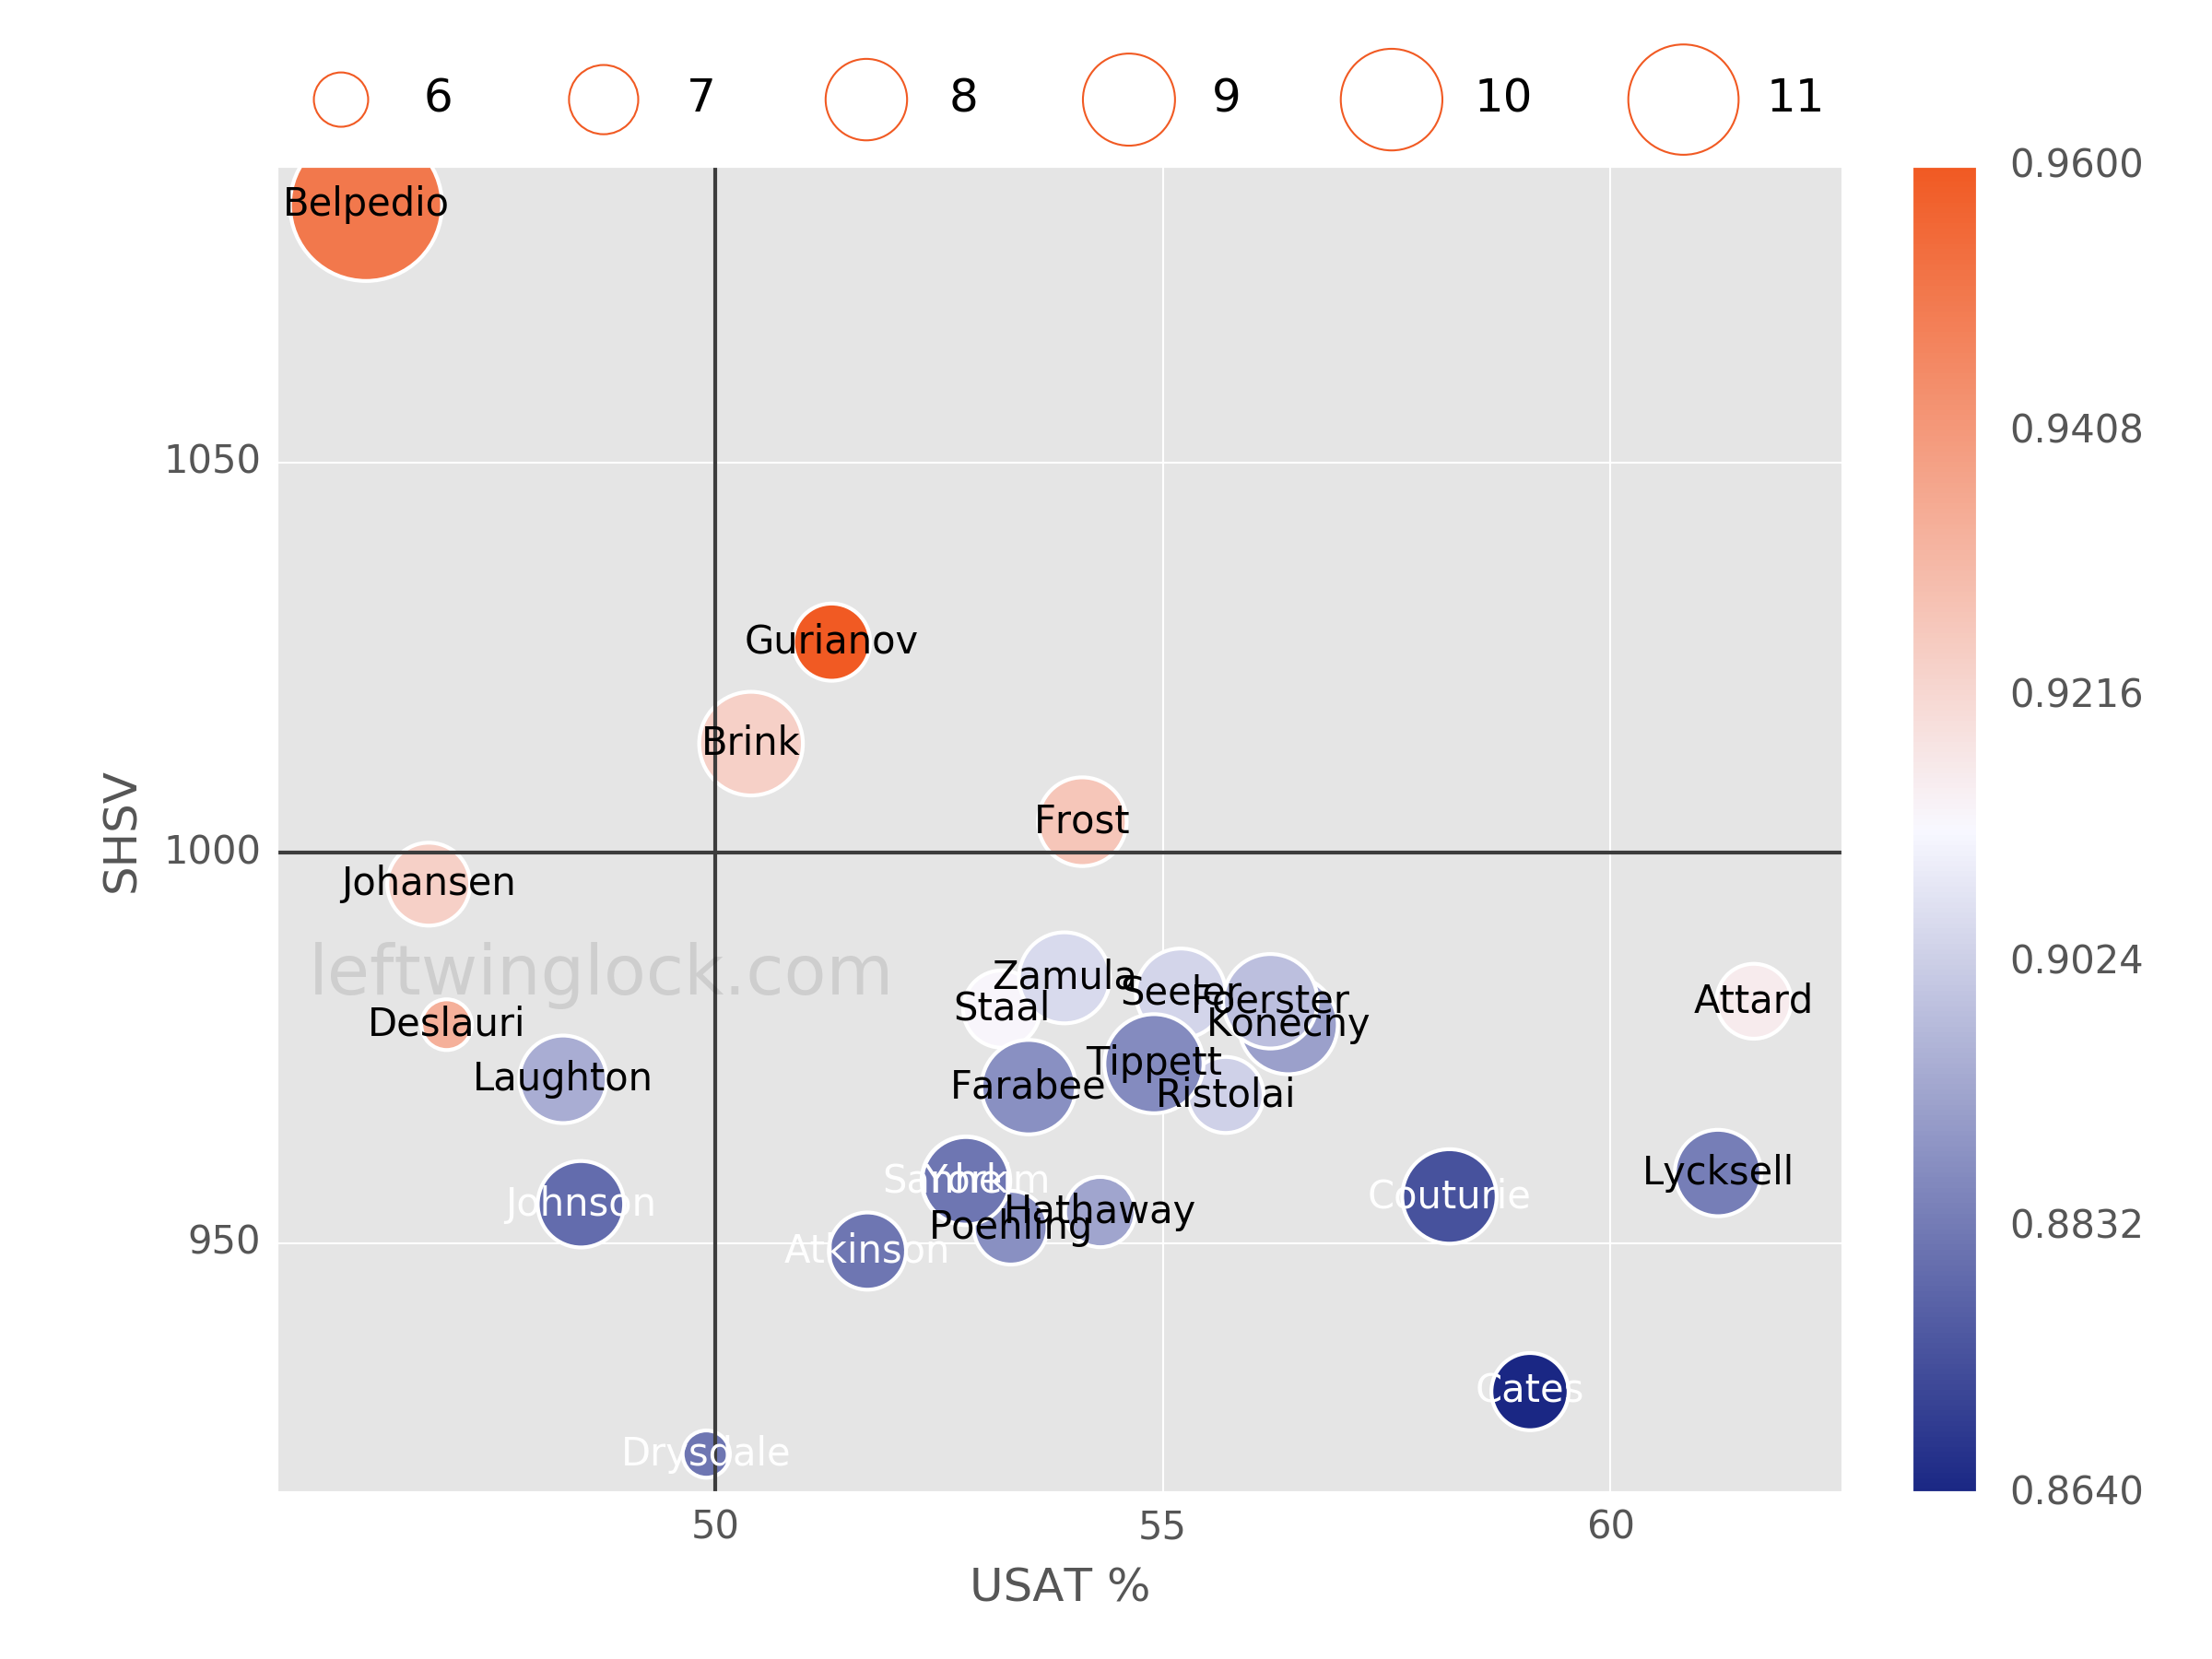
Player Usage Chart / Possession and Luck Chart